When a report is published in chart or graph format, the report will be rendered in the Published Report View workspace and the Published Chart View context ribbon will activate for the report.

The View tab section includes the following:
•Drill Down – This section contains the option to change the drill down order for the report.
•Display – This section contains the options to switch to standard line-and-row format as well as to elect to show hidden columns or lines.
The Change Report Prompt button allows you to re-run the report using different report prompts with the data which was available when that report was published. The report will open in the Published Reports Workspace in addition to the report which was just run.
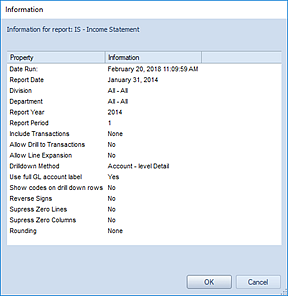
•Information – This option returns report information such as when the report was run, the parameters, report year and period.


The Layout tab section includes the following:
•Title – This section contains functions to control how the chart title is shown or to hide the chart title.
•General – This section controls the color appearance of the items of the chart. You can select from Default (which is the default for the chart type), Solid Color, Horizontal, Vertical, Bevel and Pipe.
•Labels – This section provides options on how data labels are shown on the chart. (Data labels will reflect the data formatting, such as percentages, commas, etc.)
•Legend – This section provides options on how a data legend may appear on the chart.

The Options tab section includes the following:
•Pie Options – This section contains the report configuration settings to group or explode Pie chart slices as well as to fit the chart to the screen. When grouping pie chart slices you can select the percentage threshold using the slider bar. You can set the threshold to allow for grouping of items from anywhere from 1 to 20 % of the total.
•Line Options – This section contains options for how line graphs
are rendered, including the option to show data markers, their size and format,
as well as line widths and styles.
Note: The data markers checkbox is
not available and will be disabled on 3D charts. Data markers are not available
for 3D charts.